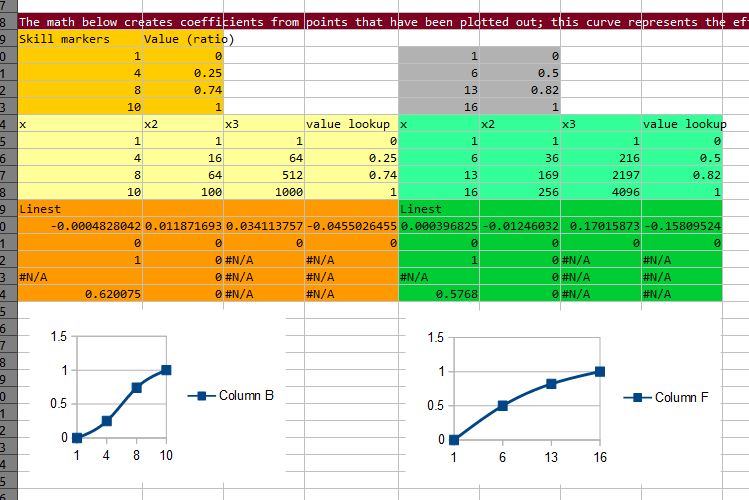
So I had been working in Open Office Calc recently, something I didn’t expect to do more than just table up some values and do simple additions. In fact, I got a little deeper than I thought I would.
Normally, I would weigh up the worth of learning something new with the practicality of getting stuff done. Furthermore, ‘getting stuff done’ is about keeping the flow of the work going so that I don’t get stuck, don’t procrastinate, don’t lose my train of thought. So it’s more than just producing new code, or new assets; it’s about striking when and where the iron is hot.
I had been working on tables in Calc because I use lookups for system rolls such as chance-to-hit and defence. Up to this point I had been simply inputting the values by hand (temporarily hard-coding it in Unity). But I realised that I wanted a way to visualise skill improvements as the player levelled up and apply this visualisation to the actual values. This visualisation was simply being able to draw a curve that represents increase of values over another value (eg skills).

The basic premise is that I define a curve, whose Y value is from 0-1, and whose X value represents a real number, which, in the case I had been working on, skill level points of the player. (Thinking about it now, I could have further made the curve generic by using 0-1 on the X as well and interpolate the skill points on the table.) When the curve is defined, I take the min/max values that are pre-defined, map the inbetween values using the interpolation code, which derives itself from the curve.
This was just as much to do with automation as it is with experimentation and balancing; it would take too much time to keep tweaking a list of skill values vis a vis a corresponding item for that skill value (eg “how much disguise bonus do we award a player who wears a hoodie at a given skill level?”).
Linear interpolation is quick and dirty, but is simply a compromise. I could have compromised and put more code into Unity to interpolate internally, but that’s just putting more code than required.
So I turned to Calc’s cell formula functionality. I have no deep understanding of Calc, so I relied on someone else’s example to learn from. Though this was not the first time I brushed with polynormals, coefficients, and plotting curves, I’m math-stupid, so it takes me some time to figure it out. This kind of math is something that always interested me, but interest and talent are two different things. I wish I was smarter in math; it would make my life so much easier.
Anyway, after 2 hours looking into the math, I figured out what the example was getting at. With this technique sorted, it frees me up to implement more lookups that require curve interpolation. It’s easier to see what’s going, instead of just looking at numbers. Also, it’s much easier to tweak the system, to balance the game as I continue to develop.